Are you tired of the same old brochures and reports with loads of copy? I mean, who wants to read all that anyway. There’s got to be a better way to illustrate important information. There is!
Infographics are a big trend right now! They can add a lot of visual interest to engage the reader.
- Use them in small amounts throughout a brochure to break up the copy
- Use them on your web site to communicate specific stats or call outs
- Use them to present the information gathered in your post-show report
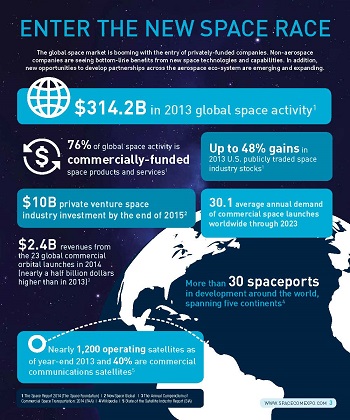
Hard stats such as percentages, attendance numbers, size comparisons, number comparisons from year to year, etc. are all great info to work with!
Have you tried it?
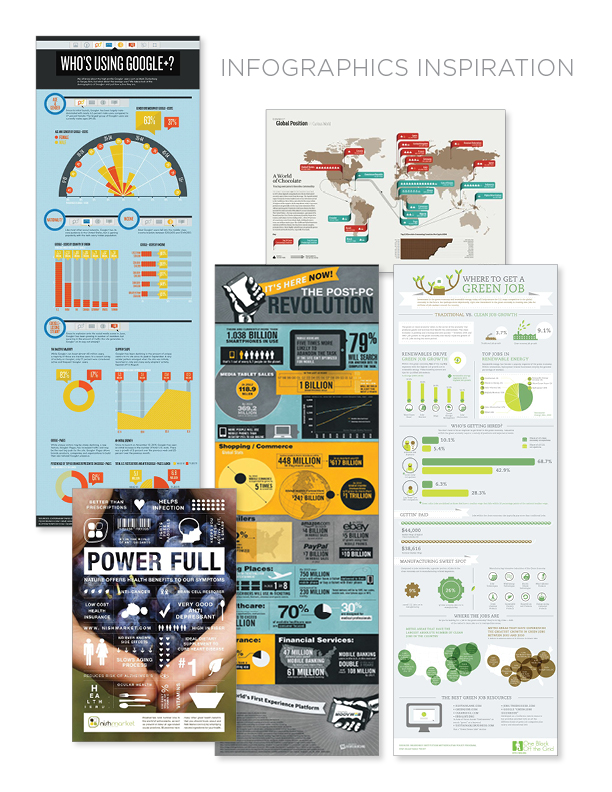
I made this little collage to show some different inspiration that I pull from.